Saltar al contenido

tools

50 de las mejores herramientas online para profesores

No es una exageración afirmar que hay ciento de aplicaciones educativas por ahí por la red, para todos los gustos y de todos los colores, por lo que es difícil tratar de recogerlas todas en un listado. Sin embargo, algunas destacan más que otras por su innovación y por su capacidad para conseguir adeptos, y esas son las que protagonizan la presente recopilación.

Son 50 interesantes herramientas online basadas en las recopilaciones de EduArea.

Collage 1
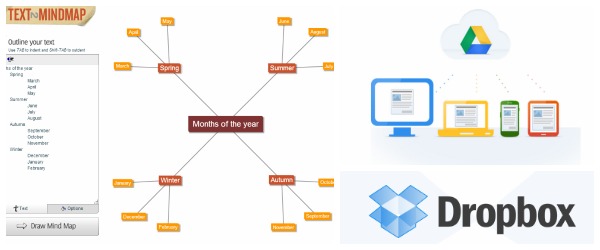
1. Dropbox: Un disco duro virtual con varios GB gratuitos y al que se accede desde casi cualquier dispositivo. Sin embargo, es muchísimo más que eso, de hecho ya comentamos 20 razones.
2. Google Drive: La evolución de Google Docs que suma a sus múltiples herramientas de creación de documentos, un considerable espacio virtual gratuito.
3. CloudMagic: Una extensión y una app multidispositivo para buscar información simultáneamente en Gmail, Twitter, Facebook, Evernote y muchos otros servicios.
4. Jumpshare: Para compartir documentos en segundos y permitir su visualización online, además de su descarga. Quedan disponibles en la nube durante dos semanas.
5. Weebly: Una herramienta para crear sitios web que destaca por su cómodo editor visual y su bajo costo, empezando por un cómodo plan gratuito.
6. Issuu: También para compartir documentos pero principalmente aquellos cuya importancia radica en su contenido gráfico ya que su especialidad son las opciones de visualización.
7. ePubBud: Un espacio para crear ebooks y publicarlos. También sirve para buscar ejemplares aunque para esta tarea hay decenas de alternativas.
8. Infogr.am: Para crear coloridas infografías interactivas, con brillantes herramientas para ingresar y tratar datos gráficamente incluyendo una minihoja de cálculo desplegable.
9. Text2MindMap: Una herramienta para crear mapas mentales a través de un pequeño editor de texto y un tablero interactivo muy fácil de usar.
10. EdCanvas: Para crear y compartir las lecciones de las clases en formato digital.

prezi
11. TubeBox: Para bajar videos de YouTube, Vimeo, DailyMotion, etc.
12. ClassDojo: Para la gestión de informes respecto al comportamiento de los estudiantes, bastante útil para compartir con los padres de familia.
13. Animoto: Personalmente le promuevo como la mejor herramienta para crear videos online a partir de material multimedia (fotos, videos, texto, etc.) almacenado localmente o simplemente usando el disponible en la red.
14. Todaysmeet: Una rápida opción para crear salas de chat.
15. Slideshare: La mejor opción para crear y compartir presentaciones con diapositivas desde un canal personal, permitir su visualización y un espacio para retroalimentarse con los comentarios.
16. Voki: Para crear un avatar parlante que acompañe las lecciones multimedia.
17. Screen Capture by Google (Google Chrome) y Screenshot (Mozilla Firefox): Extensiones para tomar capturas de pantalla, guardarlas y/o compartirlas vía redes sociales. Si prefieres una aplicación de escritorio mi recomendación es Screenpresso.
18. RecordMP3: Para grabar y compartir audio en mp3.
19. Diigo: La alternativa a Delicious para la gestión y captura de enlaces.
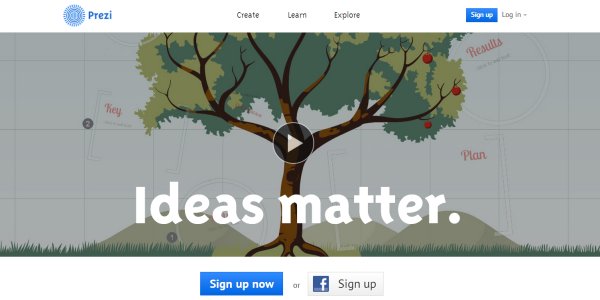
20. Prezi: El sustituto del somnífero Microsoft PowerPoint que lleva a un nuevo nivel las presentaciones gracias a sus herramientas interactivas, visualizaciones fascinantes, elegantes estilos, un editor realmente sencillo, enlaces a contenido online, etc.

Collage 3
21. Picmonkey: Un fascinante editor de imágenes online, el sustituto -literalmente- de Picnik. Cuenta con filtros, opciones para crear collages y muchas más funciones avanzadas de fácil uso.
22. Loopster: Otro muy sencillo editor de video online.
23. PlanBoard: Para planear eficientemente las lecciones.
24. Scoop.it y Paper.li: Herramientas de curación de contenidos web.
25. Socrative: Las laptops, las tabletas y los smartphones se han adueñado de las aulas, así que qué mejor que sacarles un mejor provecho, en este caso, con juegos, tareas y exposiciones interactivas entre dispositivos.
26. Join.me: Una herramienta para compartir pantalla y trabajar en equipo.
27. Zamzar: Un potente convertidor de ficheros en montones de formatos de documentos, imágenes, videos, música, ebooks, etc.
28. Poll Everywhere: Crear rápidas encuestas con votaciones instantáneas vía Twitter, SMS y más.
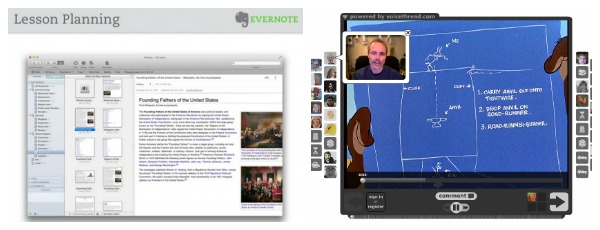
29. VoiceThread: Para grabar y compartir todo tipo de material multimedia en forma de presentaciones, con comentarios en audio y video.
30. Evernote: Simplemente una herramienta de notas de otro mundo. Sus variados usos para el mundo académico van desde la gestión de lecciones hasta la recopilación de contenido multimedia en la red mediante su capturador web.

Collage 4
31. TeachersPayTeachers: Intercambio de lecciones entre colegas.
32. Gnowledge: Un espacio para crear y compartir pruebas tipo test y ejercicios tanto con estudiantes como con otros maestros.
33. Udemy: Para crear cursos en línea mediante eficientes herramientas de gestión de contenidos, de promoción, de suscripción y hasta de colaboración gracias a su inmensa comunidad que trasciende continentes.
34. Plagiarisma.net: Una de las muchas opciones en línea para detectar plagio en escritos.
35. Academia.edu: La más amplia comunidad de académicos que permite un muy fácil contacto entre pares gracias a sus opciones para destacar intereses, áreas de interés y localizaciones. También es un buen espacio para encontrar y compartir papers.
36. Blogger: Para crear un blog en instantes con la ayuda de la fascinante plataforma de Google, lo que facilita la integración de otros servicios de la compañía para la gestión multimedia.
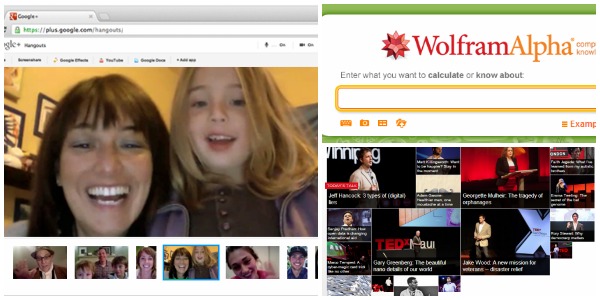
37. TED: Miles de conferencias en video, sobre centenares de áreas del conocimiento, dadas por expertos de talla mundial.
38. Wolfram Alpha: Todo el conocimiento mundial tras un pequeño cajón de búsqueda. Una de las muchas cosas que hace es resolver todo tipo de ejercicios matemáticos, sobresaliendo incluso frente aotras brillantes opciones.
39. TinyChat: Un sala de videochat muy cómoda por permitir el acceso a través de redes sociales, hasta 12 personas compartiendo su webcam y el resto comentando con mensajes. Por cierto, para realizar videoconferencias, puedes revisar nuestro previo listado con 10 elegantes ejemplares.
40. Google+: La red social de Google está a años luz de distancia de sus competidores respecto a integración de servicios (Drive y YouTube los mejores) y herramientas eficientes como sus populares Hangouts. Eso sólo es en general pues los usos académicos son bastante variados.

Collage 5
41. Olesur: Para crear PDF’s con problemas de matemáticas, fichas de lectoescritura, actividades de refuerzo y caligrafía, y más recursos didácticos para imprimir.
42. Pinterest: Para organizar categóricamente todo tipo de material gráfico en pequeños grupos (tableros) para luego compartirlos vía redes sociales o simplemente mantenerlos de forma privada. Unmockup especializado para la educación es Learni.st.
43. LaTeX Lab: Un editor de LaTeX online con la tecnología de los documentos de Google.
44. Wiggio: Una de las muchas potentes herramientas para los trabajos en grupo, con listas de tareas, calendario, encuestas, perfiles y varias funciones de interacción.
45. WordPress.org: Similar a Blogger en la facilidad para la creación de blogs o paǵinas web sobre cualquier tema, un poco más limitado en cuestión de uso de recursos pero mucho más elegante.
46. YouTube para escuelas: Una versión especial de YouTube para educadores donde se podrá disponer de cientos de videos académicos de sitios como YouTube EDU, Stanford y TED.
47. Khan Academy: Miles de clases, de altísima calidad, en video sobre diferentes campos del conocimiento ofrecidas por maestros de todo el mundo. Cualquiera puede colaborar con el proyecto.
48. Moodle: Una plataforma libre para la creación de cursos tipo LMS, similar a BlackBoard pero totalmente libre, con más herramientas interactivas y una amplia comunidad tras su desarrollo y continuo mejoramiento.
49. Canvas: También para la gestión de cursos, totalmente online (sin instalación en servidor propio), mucho más elegante y más fácil de utilizar.
50. Google Calendar: Para la gestión del tiempo y las tareas, aunque también es muy útil específicamente para crear calendarios (por ejemplo sobre horarios de atención a estudiantes o fechas de exámenes y trabajos) y compartirlos.

20 linux systems Monitoring Tools Every SysAdmin should Know

http://www.cyberciti.biz/tips/top-linux-monitoring-tools.html

Need to monitor Linux server performance? Try these built-in command and a few add-on tools. Most Linux distributions are equipped with tons of monitoring. These tools provide metrics which can be used to get information about system activities. You can use these tools to find the possible causes of a performance problem. The commands discussed below are some of the most basic commands when it comes to system analysis and debugging server issues such as:

  1. Finding out bottlenecks.
  2. Disk (storage) bottlenecks.
  3. CPU and memory bottlenecks.
  4. Network bottlenecks.

#1: top – Process Activity Command

The top program provides a dynamic real-time view of a running system i.e. actual process activity. By default, it displays the most CPU-intensive tasks running on the server and updates the list every five seconds.

Fig.01: Linux top commandFig.01: Linux top command

Commonly Used Hot Keys

The top command provides several useful hot keys:

Hot Key Usage
t Displays summary information off and on.
m Displays memory information off and on.
A Sorts the display by top consumers of various system resources. Useful for quick identification of performance-hungry tasks on a system.
f Enters an interactive configuration screen for top. Helpful for setting up top for a specific task.
o Enables you to interactively select the ordering within top.
r Issues renice command.
k Issues kill command.
z Turn on or off color/mono

=> Related: How do I Find Out Linux CPU Utilization?

#2: vmstat – System Activity, Hardware and System Information

The command vmstat reports information about processes, memory, paging, block IO, traps, and cpu activity.
# vmstat 3
Sample Outputs:

procs -----------memory---------- ---swap-- -----io---- --system-- -----cpu------
 r  b   swpd   free   buff  cache   si   so    bi    bo   in   cs us sy id wa st
 0  0      0 2540988 522188 5130400    0    0     2    32    4    2  4  1 96  0  0
 1  0      0 2540988 522188 5130400    0    0     0   720 1199  665  1  0 99  0  0
 0  0      0 2540956 522188 5130400    0    0     0     0 1151 1569  4  1 95  0  0
 0  0      0 2540956 522188 5130500    0    0     0     6 1117  439  1  0 99  0  0
 0  0      0 2540940 522188 5130512    0    0     0   536 1189  932  1  0 98  0  0
 0  0      0 2538444 522188 5130588    0    0     0     0 1187 1417  4  1 96  0  0
 0  0      0 2490060 522188 5130640    0    0     0    18 1253 1123  5  1 94  0  0

Display Memory Utilization Slabinfo

# vmstat -m

Get Information About Active / Inactive Memory Pages

# vmstat -a
=> Related: How do I find out Linux Resource utilization to detect system bottlenecks?

#3: w – Find Out Who Is Logged on And What They Are Doing

w command displays information about the users currently on the machine, and their processes.
# w username
# w vivek

Sample Outputs:

 17:58:47 up 5 days, 20:28,  2 users,  load average: 0.36, 0.26, 0.24
USER     TTY      FROM              LOGIN@   IDLE   JCPU   PCPU WHAT
root     pts/0    10.1.3.145       14:55    5.00s  0.04s  0.02s vim /etc/resolv.conf
root     pts/1    10.1.3.145       17:43    0.00s  0.03s  0.00s w

#4: uptime – Tell How Long The System Has Been Running

The uptime command can be used to see how long the server has been running. The current time, how long the system has been running, how many users are currently logged on, and the system load averages for the past 1, 5, and 15 minutes.
# uptime
Output:

 18:02:41 up 41 days, 23:42,  1 user,  load average: 0.00, 0.00, 0.00

1 can be considered as optimal load value. The load can change from system to system. For a single CPU system 1 – 3 and SMP systems 6-10 load value might be acceptable.

#5: ps – Displays The Processes

ps command will report a snapshot of the current processes. To select all processes use the -A or -e option:
# ps -A
Sample Outputs:

  PID TTY          TIME CMD
    1 ?        00:00:02 init
    2 ?        00:00:02 migration/0
    3 ?        00:00:01 ksoftirqd/0
    4 ?        00:00:00 watchdog/0
    5 ?        00:00:00 migration/1
    6 ?        00:00:15 ksoftirqd/1
....
.....
 4881 ?        00:53:28 java
 4885 tty1     00:00:00 mingetty
 4886 tty2     00:00:00 mingetty
 4887 tty3     00:00:00 mingetty
 4888 tty4     00:00:00 mingetty
 4891 tty5     00:00:00 mingetty
 4892 tty6     00:00:00 mingetty
 4893 ttyS1    00:00:00 agetty
12853 ?        00:00:00 cifsoplockd
12854 ?        00:00:00 cifsdnotifyd
14231 ?        00:10:34 lighttpd
14232 ?        00:00:00 php-cgi
54981 pts/0    00:00:00 vim
55465 ?        00:00:00 php-cgi
55546 ?        00:00:00 bind9-snmp-stat
55704 pts/1    00:00:00 ps

ps is just like top but provides more information.

Show Long Format Output

# ps -Al
To turn on extra full mode (it will show command line arguments passed to process):
# ps -AlF

To See Threads ( LWP and NLWP)

# ps -AlFH

To See Threads After Processes

# ps -AlLm

Print All Process On The Server

# ps ax
# ps axu

Print A Process Tree

# ps -ejH
# ps axjf
# pstree

Print Security Information

# ps -eo euser,ruser,suser,fuser,f,comm,label
# ps axZ
# ps -eM

See Every Process Running As User Vivek

# ps -U vivek -u vivek u

Set Output In a User-Defined Format

# ps -eo pid,tid,class,rtprio,ni,pri,psr,pcpu,stat,wchan:14,comm
# ps axo stat,euid,ruid,tty,tpgid,sess,pgrp,ppid,pid,pcpu,comm
# ps -eopid,tt,user,fname,tmout,f,wchan

Display Only The Process IDs of Lighttpd

# ps -C lighttpd -o pid=
OR
# pgrep lighttpd
OR
# pgrep -u vivek php-cgi

Display The Name of PID 55977

# ps -p 55977 -o comm=

Find Out The Top 10 Memory Consuming Process

# ps -auxf | sort -nr -k 4 | head -10

Find Out top 10 CPU Consuming Process

# ps -auxf | sort -nr -k 3 | head -10

#6: free – Memory Usage

The command free displays the total amount of free and used physical and swap memory in the system, as well as the buffers used by the kernel.
# free
Sample Output:

            total       used       free     shared    buffers     cached
Mem:      12302896    9739664    2563232          0     523124    5154740
-/+ buffers/cache:    4061800    8241096
Swap:      1052248          0    1052248

=> Related: :

  1. Linux Find Out Virtual Memory PAGESIZE
  2. Linux Limit CPU Usage Per Process
  3. How much RAM does my Ubuntu / Fedora Linux desktop PC have?

#7: iostat – Average CPU Load, Disk Activity

The command iostat report Central Processing Unit (CPU) statistics and input/output statistics for devices, partitions and network filesystems (NFS).
# iostat
Sample Outputs:

Linux 2.6.18-128.1.14.el5 (www03.nixcraft.in) 	06/26/2009
avg-cpu:  %user   %nice %system %iowait  %steal   %idle
           3.50    0.09    0.51    0.03    0.00   95.86
Device:            tps   Blk_read/s   Blk_wrtn/s   Blk_read   Blk_wrtn
sda              22.04        31.88       512.03   16193351  260102868
sda1              0.00         0.00         0.00       2166        180
sda2             22.04        31.87       512.03   16189010  260102688
sda3              0.00         0.00         0.00       1615          0

=> Related: : Linux Track NFS Directory / Disk I/O Stats

#8: sar – Collect and Report System Activity

The sar command is used to collect, report, and save system activity information. To see network counter, enter:
# sar -n DEV | more
To display the network counters from the 24th:
# sar -n DEV -f /var/log/sa/sa24 | more
You can also display real time usage using sar:
# sar 4 5
Sample Outputs:

Linux 2.6.18-128.1.14.el5 (www03.nixcraft.in) 		06/26/2009
06:45:12 PM       CPU     %user     %nice   %system   %iowait    %steal     %idle
06:45:16 PM       all      2.00      0.00      0.22      0.00      0.00     97.78
06:45:20 PM       all      2.07      0.00      0.38      0.03      0.00     97.52
06:45:24 PM       all      0.94      0.00      0.28      0.00      0.00     98.78
06:45:28 PM       all      1.56      0.00      0.22      0.00      0.00     98.22
06:45:32 PM       all      3.53      0.00      0.25      0.03      0.00     96.19
Average:          all      2.02      0.00      0.27      0.01      0.00     97.70

=> Related: : How to collect Linux system utilization data into a file

#9: mpstat – Multiprocessor Usage

The mpstat command displays activities for each available processor, processor 0 being the first one. mpstat -P ALL to display average CPU utilization per processor:
# mpstat -P ALL
Sample Output:

Linux 2.6.18-128.1.14.el5 (www03.nixcraft.in)	 	06/26/2009
06:48:11 PM  CPU   %user   %nice    %sys %iowait    %irq   %soft  %steal   %idle    intr/s
06:48:11 PM  all    3.50    0.09    0.34    0.03    0.01    0.17    0.00   95.86   1218.04
06:48:11 PM    0    3.44    0.08    0.31    0.02    0.00    0.12    0.00   96.04   1000.31
06:48:11 PM    1    3.10    0.08    0.32    0.09    0.02    0.11    0.00   96.28     34.93
06:48:11 PM    2    4.16    0.11    0.36    0.02    0.00    0.11    0.00   95.25      0.00
06:48:11 PM    3    3.77    0.11    0.38    0.03    0.01    0.24    0.00   95.46     44.80
06:48:11 PM    4    2.96    0.07    0.29    0.04    0.02    0.10    0.00   96.52     25.91
06:48:11 PM    5    3.26    0.08    0.28    0.03    0.01    0.10    0.00   96.23     14.98
06:48:11 PM    6    4.00    0.10    0.34    0.01    0.00    0.13    0.00   95.42      3.75
06:48:11 PM    7    3.30    0.11    0.39    0.03    0.01    0.46    0.00   95.69     76.89

=> Related: : Linux display each multiple SMP CPU processors utilization individually.

#10: pmap – Process Memory Usage

The command pmap report memory map of a process. Use this command to find out causes of memory bottlenecks.
# pmap -d PID
To display process memory information for pid # 47394, enter:
# pmap -d 47394
Sample Outputs:

47394:   /usr/bin/php-cgi
Address           Kbytes Mode  Offset           Device    Mapping
0000000000400000    2584 r-x-- 0000000000000000 008:00002 php-cgi
0000000000886000     140 rw--- 0000000000286000 008:00002 php-cgi
00000000008a9000      52 rw--- 00000000008a9000 000:00000   [ anon ]
0000000000aa8000      76 rw--- 00000000002a8000 008:00002 php-cgi
000000000f678000    1980 rw--- 000000000f678000 000:00000   [ anon ]
000000314a600000     112 r-x-- 0000000000000000 008:00002 ld-2.5.so
000000314a81b000       4 r---- 000000000001b000 008:00002 ld-2.5.so
000000314a81c000       4 rw--- 000000000001c000 008:00002 ld-2.5.so
000000314aa00000    1328 r-x-- 0000000000000000 008:00002 libc-2.5.so
000000314ab4c000    2048 ----- 000000000014c000 008:00002 libc-2.5.so
.....
......
..
00002af8d48fd000       4 rw--- 0000000000006000 008:00002 xsl.so
00002af8d490c000      40 r-x-- 0000000000000000 008:00002 libnss_files-2.5.so
00002af8d4916000    2044 ----- 000000000000a000 008:00002 libnss_files-2.5.so
00002af8d4b15000       4 r---- 0000000000009000 008:00002 libnss_files-2.5.so
00002af8d4b16000       4 rw--- 000000000000a000 008:00002 libnss_files-2.5.so
00002af8d4b17000  768000 rw-s- 0000000000000000 000:00009 zero (deleted)
00007fffc95fe000      84 rw--- 00007ffffffea000 000:00000   [ stack ]
ffffffffff600000    8192 ----- 0000000000000000 000:00000   [ anon ]
mapped: 933712K    writeable/private: 4304K    shared: 768000K

The last line is very important:

  • mapped: 933712K total amount of memory mapped to files
  • writeable/private: 4304K the amount of private address space
  • shared: 768000K the amount of address space this process is sharing with others

=> Related: : Linux find the memory used by a program / process using pmap command

#11 and #12: netstat and ss – Network Statistics

The command netstat displays network connections, routing tables, interface statistics, masquerade connections, and multicast memberships. ss command is used to dump socket statistics. It allows showing information similar to netstat. See the following resources about ss and netstat commands:

#13: iptraf – Real-time Network Statistics

The iptraf command is interactive colorful IP LAN monitor. It is an ncurses-based IP LAN monitor that generates various network statistics including TCP info, UDP counts, ICMP and OSPF information, Ethernet load info, node stats, IP checksum errors, and others. It can provide the following info in easy to read format:

  • Network traffic statistics by TCP connection
  • IP traffic statistics by network interface
  • Network traffic statistics by protocol
  • Network traffic statistics by TCP/UDP port and by packet size
  • Network traffic statistics by Layer2 address
Fig.02: General interface statistics: IP traffic statistics by network interface Fig.02: General interface statistics: IP traffic statistics by network interface
Fig.03 Network traffic statistics by TCP connectionFig.03 Network traffic statistics by TCP connection

#14: tcpdump – Detailed Network Traffic Analysis

The tcpdump is simple command that dump traffic on a network. However, you need good understanding of TCP/IP protocol to utilize this tool. For.e.g to display traffic info about DNS, enter:
# tcpdump -i eth1 'udp port 53'
To display all IPv4 HTTP packets to and from port 80, i.e. print only packets that contain data, not, for example, SYN and FIN packets and ACK-only packets, enter:
# tcpdump 'tcp port 80 and (((ip[2:2] - ((ip[0]&0xf)<<2)) - ((tcp[12]&0xf0)>>2)) != 0)'
To display all FTP session to 202.54.1.5, enter:
# tcpdump -i eth1 'dst 202.54.1.5 and (port 21 or 20'
To display all HTTP session to 192.168.1.5:
# tcpdump -ni eth0 'dst 192.168.1.5 and tcp and port http'
Use wireshark to view detailed information about files, enter:
# tcpdump -n -i eth1 -s 0 -w output.txt src or dst port 80

#15: strace – System Calls

Trace system calls and signals. This is useful for debugging webserver and other server problems. See how to use to trace the process and see What it is doing.

#16: /Proc file system – Various Kernel Statistics

/proc file system provides detailed information about various hardware devices and other Linux kernel information. See Linux kernel /proc documentations for further details. Common /proc examples:
# cat /proc/cpuinfo
# cat /proc/meminfo
# cat /proc/zoneinfo
# cat /proc/mounts

17#: Nagios – Server And Network Monitoring

Nagios is a popular open source computer system and network monitoring application software. You can easily monitor all your hosts, network equipment and services. It can send alert when things go wrong and again when they get better. FAN is «Fully Automated Nagios». FAN goals are to provide a Nagios installation including most tools provided by the Nagios Community. FAN provides a CDRom image in the standard ISO format, making it easy to easilly install a Nagios server. Added to this, a wide bunch of tools are including to the distribution, in order to improve the user experience around Nagios.

18#: Cacti – Web-based Monitoring Tool

Cacti is a complete network graphing solution designed to harness the power of RRDTool’s data storage and graphing functionality. Cacti provides a fast poller, advanced graph templating, multiple data acquisition methods, and user management features out of the box. All of this is wrapped in an intuitive, easy to use interface that makes sense for LAN-sized installations up to complex networks with hundreds of devices. It can provide data about network, CPU, memory, logged in users, Apache, DNS servers and much more. See how to install and configure Cacti network graphing tool under CentOS / RHEL.

#19: KDE System Guard – Real-time Systems Reporting and Graphing

KSysguard is a network enabled task and system monitor application for KDE desktop. This tool can be run over ssh session. It provides lots of features such as a client/server architecture that enables monitoring of local and remote hosts. The graphical front end uses so-called sensors to retrieve the information it displays. A sensor can return simple values or more complex information like tables. For each type of information, one or more displays are provided. Displays are organized in worksheets that can be saved and loaded independently from each other. So, KSysguard is not only a simple task manager but also a very powerful tool to control large server farms.

Fig.05 KDE System GuardFig.05 KDE System Guard {Image credit: Wikipedia}

See the KSysguard handbook for detailed usage.

#20: Gnome System Monitor – Real-time Systems Reporting and Graphing

The System Monitor application enables you to display basic system information and monitor system processes, usage of system resources, and file systems. You can also use System Monitor to modify the behavior of your system. Although not as powerful as the KDE System Guard, it provides the basic information which may be useful for new users:

  • Displays various basic information about the computer’s hardware and software.
  • Linux Kernel version
  • GNOME version
  • Hardware
  • Installed memory
  • Processors and speeds
  • System Status
  • Currently available disk space
  • Processes
  • Memory and swap space
  • Network usage
  • File Systems
  • Lists all mounted filesystems along with basic information about each.
Fig.06 The Gnome System Monitor applicationFig.06 The Gnome System Monitor application

Bonus: Additional Tools

A few more tools:

  • nmap – scan your server for open ports.
  • lsof – list open files, network connections and much more.
  • ntop web based tool – ntop is the best tool to see network usage in a way similar to what top command does for processes i.e. it is network traffic monitoring software. You can see network status, protocol wise distribution of traffic for UDP, TCP, DNS, HTTP and other protocols.
  • Conky – Another good monitoring tool for the X Window System. It is highly configurable and is able to monitor many system variables including the status of the CPU, memory, swap space, disk storage, temperatures, processes, network interfaces, battery power, system messages, e-mail inboxes etc.
  • GKrellM – It can be used to monitor the status of CPUs, main memory, hard disks, network interfaces, local and remote mailboxes, and many other things.
  • vnstat – vnStat is a console-based network traffic monitor. It keeps a log of hourly, daily and monthly network traffic for the selected interface(s).
  • htop – htop is an enhanced version of top, the interactive process viewer, which can display the list of processes in a tree form.
  • mtr – mtr combines the functionality of the traceroute and ping programs in a single network diagnostic tool.

Did I miss something? Please add your favorite system motoring tool in the comments.